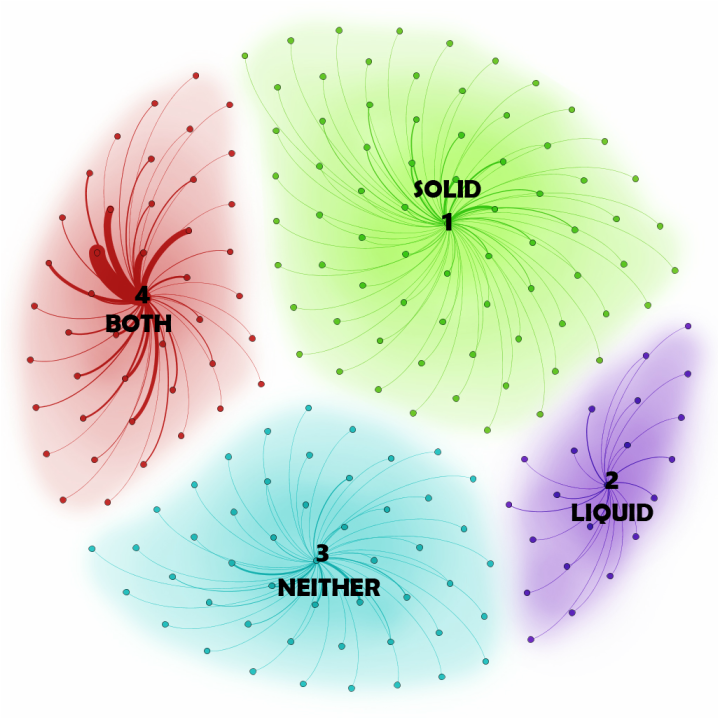
- We interpreted the flavor data as liquid, solid, both, and neither. We wanted to see how the different flavors match with their consistencies. Most flavors in our final graph were solid followed by liquid. About one third of the data collected was inapplicable. These were not flavors but instead variables that were inputted to the database. Deciding upon different categories to organize the data was challenging because the flavors ranged from food, drinks, candy, and spices to variables such as “Smoke” which isn’t a flavoring. The largest obstacle we had with graphing the data regarded extra characters in each cell creating secondary nodes for a single piece of information. We organized the data by numbers (1, 2, 3, and 4) which we placed in each cell before the flavor. Spaces between words became problematic so we removed them which only left a space between the number and flavor. This allowed the flavors to be graphed by their assigned number system.
